


Customer satisfaction is at the heart of customer loyalty, and forms one of the main pillars of the best customer experience (CX) programs. While everyone knows the importance of tracking customer satisfaction, we do not always know how to do it right. How do you define it, measure it and turn it into action? In this article, you will learn how to lay the foundations for measuring customer satisfaction. You will also learn about a range of analyses that can provide insights for developing customer-centric strategies.
Customer satisfaction is usually measured using polling and survey data, either binary, Likert or visual scales. Which scale to use depends on the research context and, above all, on the analyses to be carried out. The analyses described in this article mostly require measurement on a Likert scale. We also seek to anchor the evaluation in a time horizon (e.g. your last visit) or in a particular component (e.g. service, products, etc.), depending on business needs.
Overall, were you satisfied with your last visit?
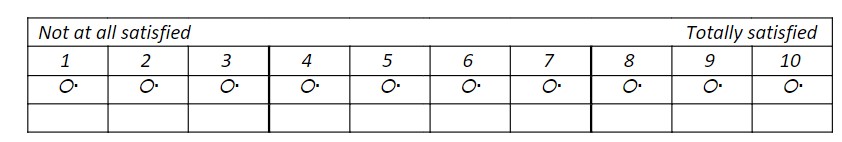
How satisfied were you with your last visit?


Other types of measurement, such as Net Promoter Score (NPS), can also be used, depending on the specific context of your company or market. One thing is certain: however you measure customer satisfaction, our experts can advise you on the most appropriate analyses to meet your needs.
In and of itself, measuring satisfaction enables you to gauge your customers’ attitudes towards your product and service offering. To take the analysis a step further, we can link it to evaluation data directly linked to your offering, to identify the perceptual customer satisfaction drivers.
For example, for a retail company, customer satisfaction may be based on product selection, price, quality, customer service or even the cleanliness of the premises. If we use a 10-point scale to measure different statements related to these attributes, we can calculate an average out of 10 for each, where the higher the number, the more favorable the measurement indicates.
This introduces the concept of performance.
Analysis of these averages enables us to assess the company’s performance in relation to the attributes measured. For example, we see below that, relative to other attributes, product selection and price are judged less favorably than “cleanliness” and customer service.
| Measurement | Average out of 10 |
| Overall satisfaction | 7.5 |
| Customer service | 8.5 |
| Cleanliness | 8.5 |
| Product quality | 8 |
| Price | 7 |
| Product Selection | 6.5 |
This data already highlights potential avenues for improvement. However, to allocate the company’s resources strategically, we could question whether it is more appropriate to prioritize selection or price to generate the greatest impact on satisfaction; we therefore introduce the concept of importance.
By measuring the importance of an attribute on overall satisfaction, we can associate a priority with the dimensions of our customer experience. For example, if we discover that customer service is the element that most influences satisfaction, it would be appropriate for us as an organization to pay particular attention to it.
The importance of an attribute on satisfaction can be quantified either in a declarative manner or by inference. Declaratively, we can simply survey customers as to the importance they attach to different attributes (e.g.: How important is each of the following to you?). However, this method can lead to bias. A respondent will have difficulty projecting his or her preferences when answering the questionnaire, compared with how he or she would act, potentially under different conditions.
Thanks to inference, we can compare customers’ evaluations of the various dimensions with their overall level of satisfaction to detect the importance attached to each without having to ask the question directly. For example, we might note that the cleaner customers find the store, the more generally satisfied they tend to be, suggesting that cleanliness is a driver of satisfaction. Various methods exist for quantifying importance, such as relative importance analysis (Shapley/Johnson) or expectation analysis (tetraclass).
Relative importance analysis is used to infer the importance of each attribute through a series of regressions. The performance and importance of each attribute can then be crossed on a Cartesian plane to create four quadrants, also known as the “performance/importance matrix”. The crossing points for the axes are determined according to the mean or median of all attributes.
Example of the application of relative importance analysis and a performance/importance matrix.
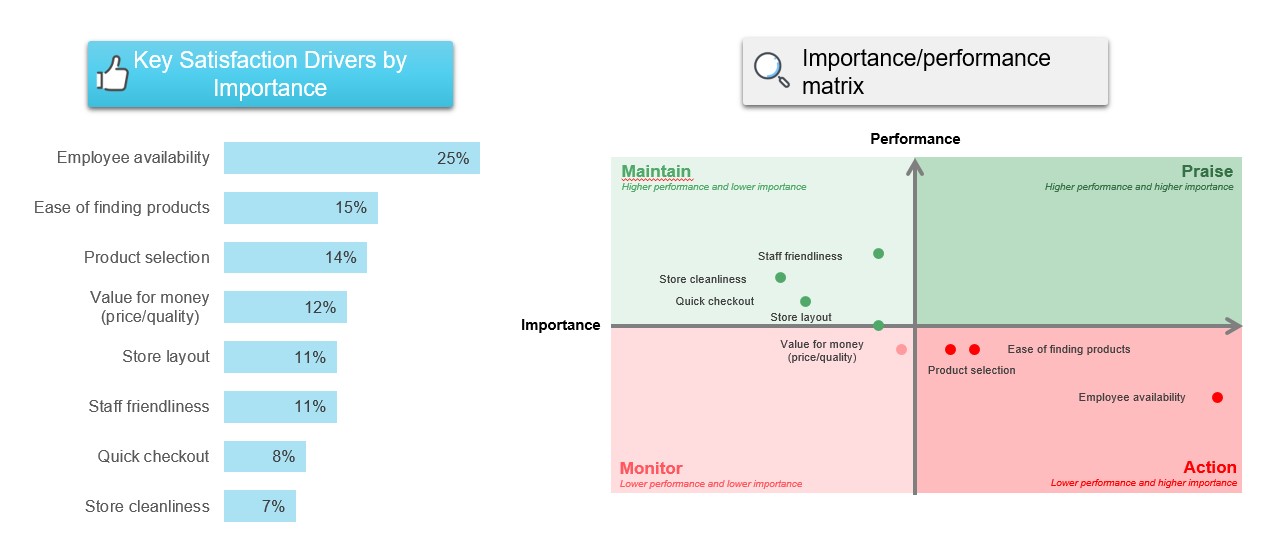
In the above example, we can see that the best-rated dimension is cashier courtesy (highest point on the vertical axis). However, this element is relatively less important, as it is located on the left-hand side of the plane. On the other hand, employee availability is an under-performing element, but has the highest impact on customer satisfaction.
If you’d like to find out more about relative importance analysis (Shapley/Johnson), please contact us.
Whereas relative importance analysis considers satisfaction as a spectrum ranging from dissatisfaction to satisfaction, tetraclass analysis is based on the idea that the same element can contribute differently to satisfaction and dissatisfaction, depending on whether the customer’s assessment is positive or negative. For example, finding a store clean might have a negligible impact on a customer’s satisfaction, but a big impact on dissatisfaction if the store is perceived as unclean. So it seems that cleanliness is a basic customer expectation. Tetraclass analysis enables you to identify the essential elements of your customer experience.
Example of the tetraclass method and matrix.
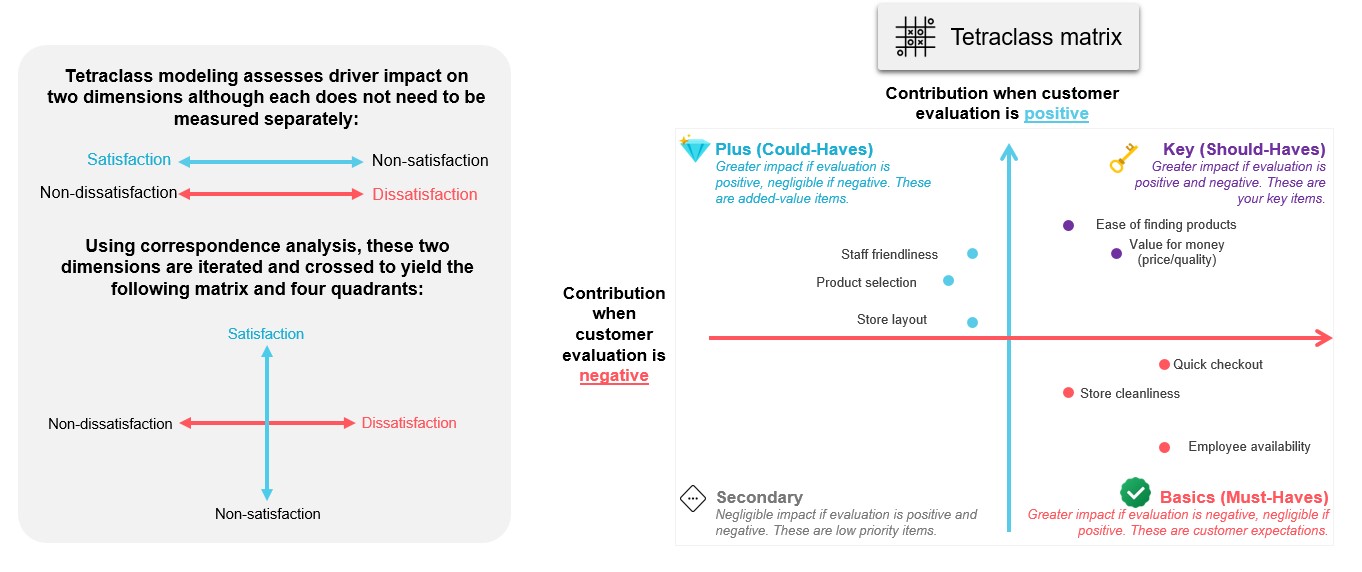
In this case, the analysis shows that store cleanliness is a basic expectation, meaning that its absence leads to dissatisfaction, but doesn’t seem to generate over-satisfaction. Conversely, cashier courtesy is not an element of dissatisfaction, but helps to improve satisfaction when present; we’re talking here about a “plus” or value-added element.
If you’d like to find out more about expectation analysis (tetraclass), please contact us.
So far, this article has focused on the perceptual levers of customer satisfaction. An organization wishing to deploy a CX program based on more than survey data might also want to discover how its own operations and transactional dynamics impact the customer experience. We’re talking about operational or internal satisfaction levers here.
By applying the lever identification techniques discussed above to internal data, we can identify priorities on which organizations can take direct action. For example, a banking institution might discover that the higher the number of calls to customer service, the more dissatisfied a customer tends to be. An analysis of internal levers therefore enables us to identify the critical internal dimensions of the customer experience and, above all, to quantify their importance in order to direct operational efforts, in terms of both technological and human capital, towards the same objective. Our experts can help you identify the operational or internal levers of customer satisfaction for your organization.
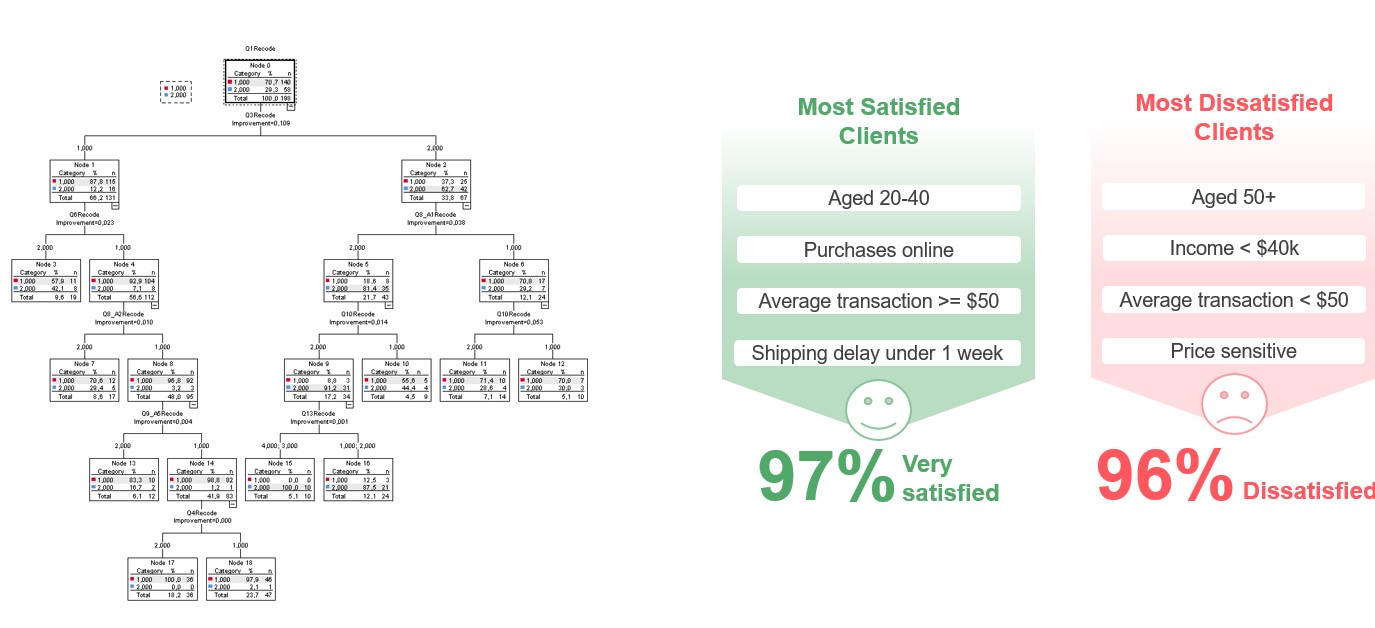
Organizations wishing to develop their analytical expertise benefit from conducting analyses to identify perceptual and internal levers. However, it can sometimes be difficult to figure out how to translate a lever into concrete action to enhance a CX program. For example, if we discover that the time in days between dispatch and receipt of an order is the most important operational lever for customer satisfaction with an online shopping site, we would naturally like to know the optimum time to respect in order to maximize satisfaction. This can be achieved by building a standard profile of satisfied and dissatisfied customers.
By constructing a standard profile of a dissatisfied customer, we could discover that the propensity to be dissatisfied is more pronounced starting from a delay of 25 days. Similarly, the standard profile of a satisfied customer could show a higher propensity to be happy with the service received when the delay is less than 7 days. This information can be used as a target for the company’s CX program.
The standard profile can also integrate other data for a more complete view, such as socio-demographic or transactional data.
Example of a standard profile using a decision tree.
Although our analyses are used individually to identify customer satisfaction priorities, their combined use enables us to target different dimensions to obtain a complete and exhaustive picture.

In addition to these analyses, our expertise in data preparation, cleaning and adjustment, descriptive and inferential analysis, and the development of machine learning models will enable you to take full advantage of your data. Contact us today.