





The start of the Canadiens’ season always brings a certain buzz to the Numea office. Last year, we built a segmentation of NHL players, which means grouping players into typical profiles based on their stats, just like we do for our clients. We did it for fun first, but also to show what a segmentation can actually be used for. Read the first edition here!
Given the interest the project got last year, we decided to rework the segmentation model more seriously. We asked our in-house “experts” for their input on choosing and defining the variables, and our model is now even more robust than last year’s.
The key to a good segmentation, and to any AI project for that matter, is data. First, you need access to clean, centralized data. In this case, we used 2025-2026 stats for 828 NHL players (source: MoneyPuck.com).
Next, as anyone who has worked on a segmentation project with us knows, the first step is to choose the key concepts that will group similar players together.
In our first edition, the variables were used as is. For example, we looked at a player’s total goals for the season. This year, we measured performance while the player is on the ice (per minute played), while still taking his total ice time into account. That way, a fourth-liner isn’t at a disadvantage against a star who plays 22 minutes a game.
We also added new concepts to better tell players apart. These indicators cover both offensive production and defensive playing style.
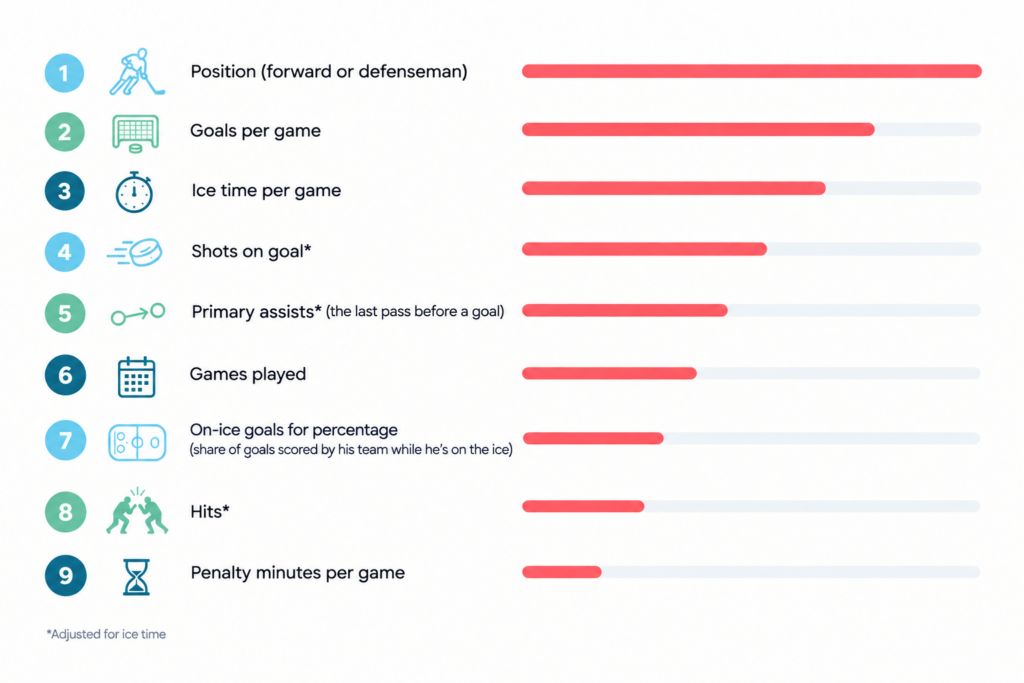
Once the variables were chosen, we grouped together the players who are most alike. The result: six segments, split into three groups: forwards, defensemen and fill-in players. Each segment plays a different role on the team, just like each type of customer in your business.
 Forwards
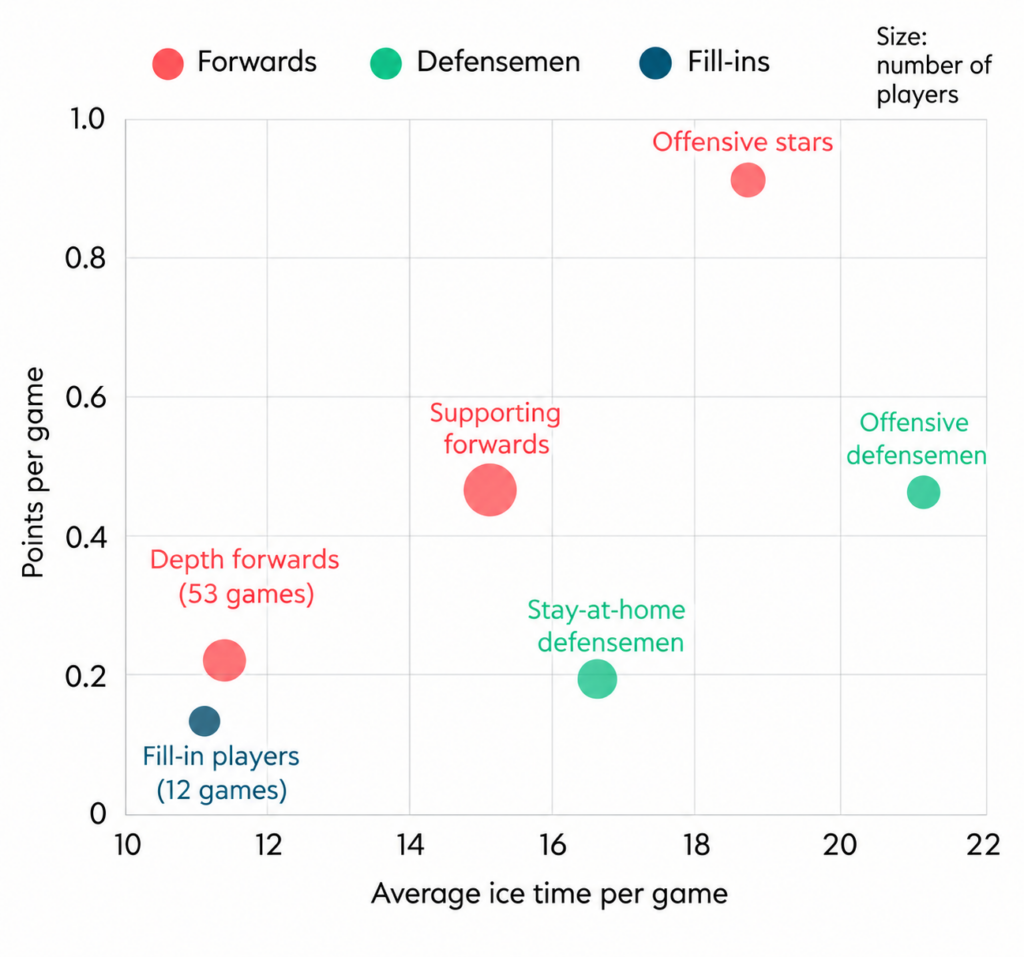
The offensive leaders. Close to a point per game and about 19 minutes of ice time a night. Almost all of them are forwards.
On the Canadiens: 14 Nick Suzuki
The largest segment in the league. Second- and third-line players: about a point every two games and 15 minutes of ice time a night.
On the Canadiens: 91 Oliver Kapanen
Fourth-liners. About 11 minutes of ice time per game and few points (0.2 per game).
On the Canadiens: 17 Josh Anderson
 Defensemen
The defensemen who play the most: over 21 minutes a game, the highest ice time of any segment. They produce about a point every two games, as much as supporting forwards.
On the Canadiens: 48 Lane Hutson
Defensemen who play regularly (16 to 17 minutes a game), but contribute little offensively (0.2 points per game).
On the Canadiens: 72 Arber Xhekaj
 Fill-in players
Call-ups, injured players or players getting a tryout. Fewer than 12 games played on average, little ice time and very few points.
On the Canadiens: 62 Owen Beck
Last year, Ivan Demidov was our example of a young Canadiens rookie. This year, with 62 points, he’s one of the offensive stars. Just like a customer, a player can move from one segment to another. That’s why it matters to track these movements over time!
The chart below places each segment on two criteria: average ice time per game and points per game. Bubble size represents the number of players in each segment (the bigger the bubble, the larger the segment). Offensive stars clearly stand out at the top, while offensive defensemen stand out for their ice time.
Note: depth forwards and fill-in players look alike on these two criteria. What really sets them apart is the number of games played.
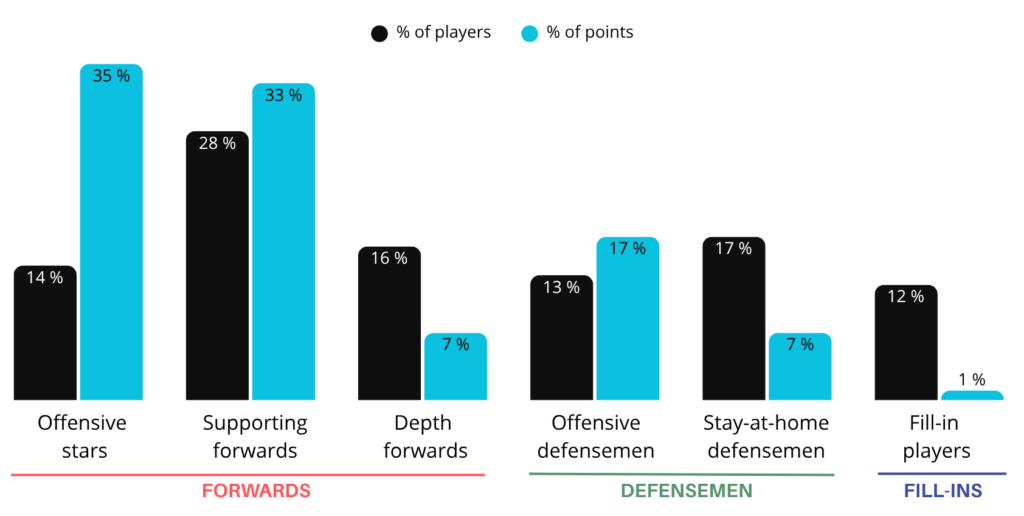
Not all segments carry the same weight. Offensive stars make up only 14% of players, yet they collect 35% of the league’s points. Add supporting forwards, and 42% of players account for 68% of points.
Your customers work the same way: a minority often generates most of your revenue. You just need to know who they are!
Looking at each team’s makeup, you can see very different strategies.
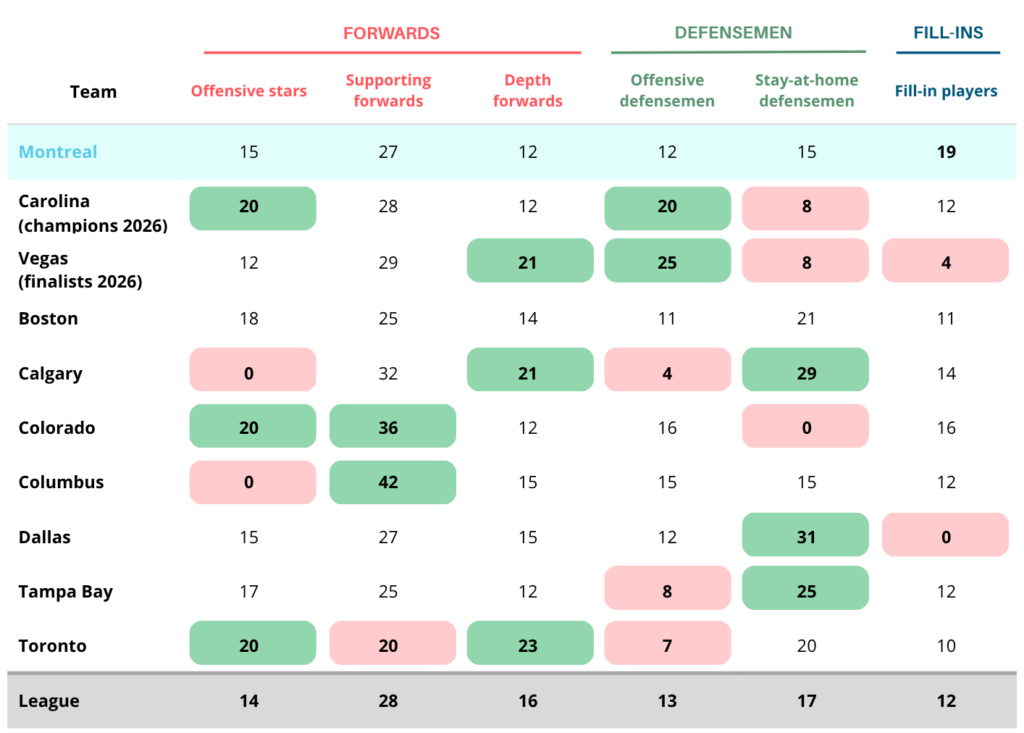
Marketing works the same way: some companies bet on their most profitable customers, while others build on a broad, stable base. What matters is knowing which mix you have, and above all, which one you want!

Replace “players” with “customers,” and the findings still hold.
In practical terms, segmentation shows you where to focus your efforts: retaining your best customers, helping those with potential grow, and adapting your approach for everyone else. A good GM knows the role of every player on the roster. Do you know the role of every one of your customers?
We segmented NHL players for fun, but the method behind it is the same one we use every day with our clients’ data.
We may not be able to predict who’ll win the Stanley Cup this year, but we can definitely help you get to know your customers better.
Discover our segmentation services
Want to segment your customers? We can help you turn data into action.