


IBM SPSS Statistics is an internationally recognized statistical analysis software. It offers a user-friendly interface and a robust set of features to solve business and research problems. Organizations use IBM SPSS Statistics to understand data, analyze trends, make forecasts, validate assumptions, and draw accurate conclusions.
IBM recently released version 29 of SPSS Statistics which includes new features, inter alia, the addition of new survival models, improved integration of open source extensions and improvements to existing statistical procedures. In addition, the workbook mode and the search function have been revised to be more user-friendly.
A comprehensive list of new and updated features is available in the IBM SPSS Statistics 29 portal in IBM Docs.
SPSS Statistics 29 features new linear OLS alternatives and supports new command inputs.
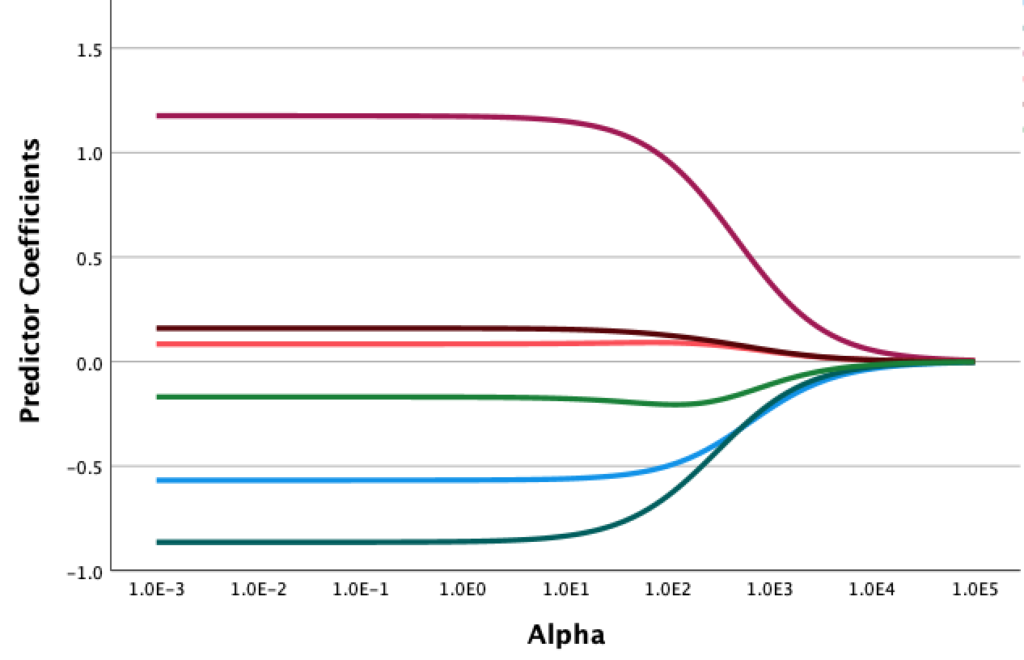
Estimates regularized linear regression models for a dependent variable on one or more independent variables. Regularization combines L1 (Lasso) and L2 (Ridge) penalties.
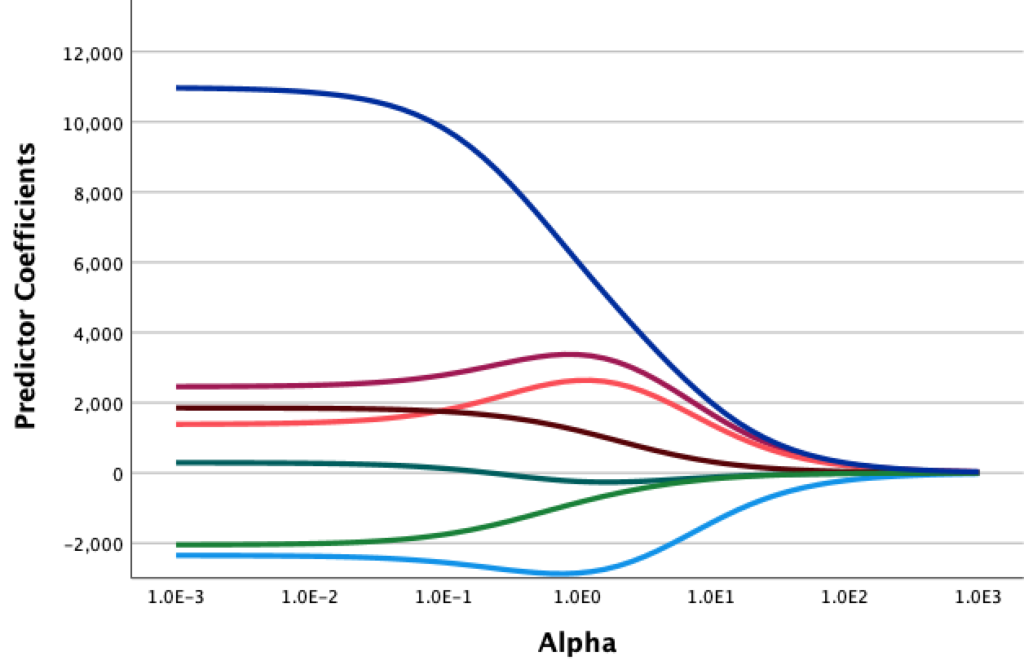
Estimates L1 loss regularized linear regression models for a dependent variable on one or more independent variables, and includes optional modes to display trace plots and to select the alpha hyperparameter value based on cross validation.
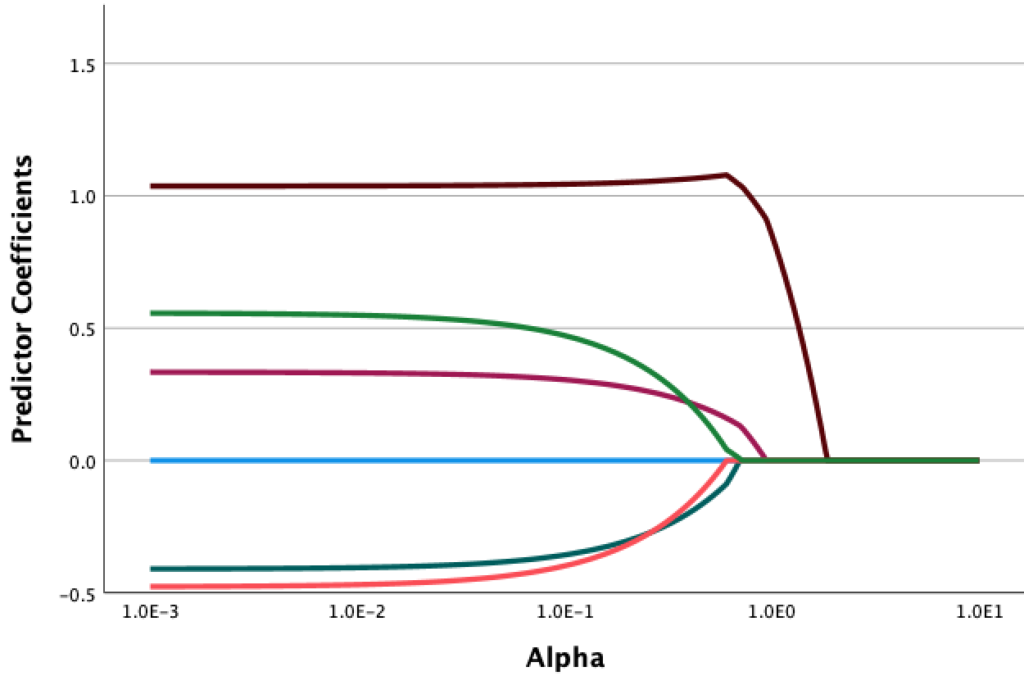
Estimates L2 or squared loss regularized linear regression models for a dependent variable on one or more independent variables, and includes optional modes to display trace plots and to select the alpha hyperparameter value based on cross validation.
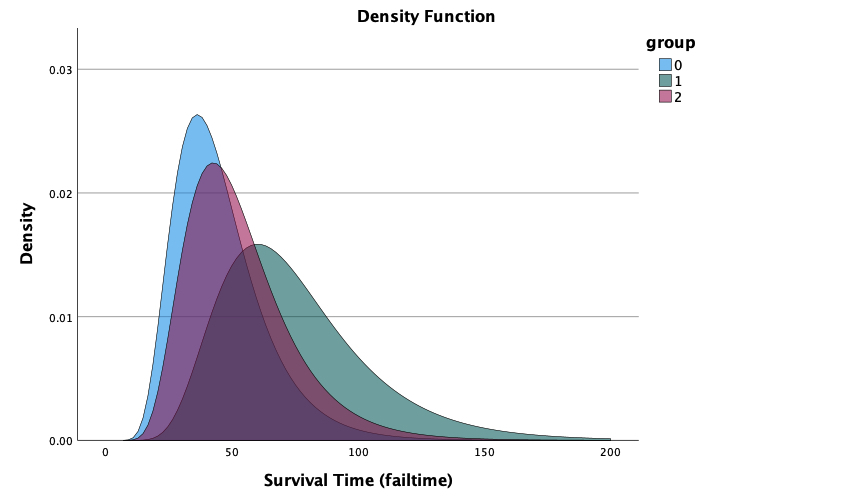
Invokes the parametric survival models procedure with non-recurrent life time data. Parametric survival models assume that survival time follow a known distribution, and this analysis fits accelerated failure time models with their model effects proportional with respect to survival time.
Pseudo-R2 measures and intra-class correlation coefficient are now included in Linear Mixed Models and Generalized Linear Mixed Models output (when appropriate).
The coefficient of determination R2 is a commonly reported statistic, because it represents the proportion of variance explained by a linear model. The intra-class correlation coefficient (ICC) is a related statistic that quantifies the proportion of variance explained by a grouping (random) factor in multilevel/ hierarchical data.
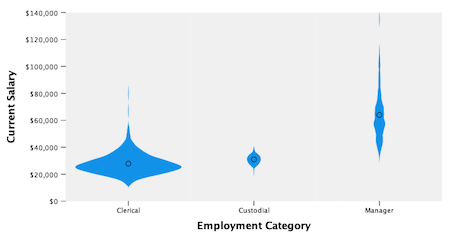
The Graphboard Template Chooser includes a new way of analyzing data which is the violin plot, a hybrid of the box and kernel density plots. Violin plots show peaks in the data and are used to visualize the distribution of numerical data. Unlike a box plot that can only show summary statistics, violin plots depict summary statistics and the density of each variable.
Unselected cases are no longer hidden in the Data Editor when a subset of cases is selected, and the unselected cases are not discarded. This represents a return to the behavior of Statistics 27.0.1 and earlier versions.
• Two new workbook toolbar items have been added:
o Show/Hide all syntax windows;
o Clear all outputs.
• There is a new button on the Status bar to toggle between Classic (Output and Syntax) and Workbook modes.
The modernized Search feature now provides options for entering terms directly into a toolbar field and for viewing top results in a drop-down pane.
Python 3.10.4 and R 4.2.0 are installed with IBM® SPSS® Statistics 29.
Register for IBM’s upcoming tech talks to deep-dive into the new statistical procedures and improvements in the latest version of SPSS Statistics.
If you’d like to purchase new IBM SPSS Statistics licenses, contact us. You can also subscribe directly on Numea’s website.
https://www.ibm.com/docs/en/spss-statistics/29.0.0?topic=overview-whats-new-in-version-29