


IBM® SPSS® Statistics enables organizations to gather rich insights from data with a powerful set of tools to validate assumptions, analyze past performance and forecast trends. To ensure that the most advanced techniques are available to a broader group of analysts and business users, enhancements have been made to the features and capabilities of the IBM SPSS Statistics portfolio.
IBM SPSS Statistics 28 introduces a new statistical procedure (meta-analysis), enhancements to existing procedures such as Power Analysis for increased research methods, data visualizations to understand connections, and functional enhancements designed to improve everyday usability.
The perpetual editions of SPSS Statistics 28—Base, Standard, Professional and Premium—deliver the long-term software access required for analytics groups. These editions group essential features, functionality, and usage requirements to offer a convenient way to acquire the capabilities you need. For individuals and organizations that require pay-as-you-go software usage, SPSS Statistics Subscription and its optional add-ons provide the desired flexibility, which you can now purchase directly from Numea’s website. The latest features and functionality are available in both IBM SPSS Statistics Subscription and IBM SPSS Statistics 28.
Meta analysis is the analysis of the data obtained from a collection of studies that answer similar research questions. These studies are known as primary studies. Meta analysis uses statistical methods to produce an overall estimate of an effect, explore between-study heterogeneity, and investigate the impact of publication bias or, more generally, small-study effects on the final results.
Here are the new Meta Analysis procedures in version 28:
IBM SPSS Statistics 28 includes an enhancement to the Power Analysis procedures to create a graphical representation of results. Power analysis plays a pivotal role in a study plan, design, and conduction. The calculation of power is usually before any sample data have been collected, except possibly from a small pilot study. The precise estimation of the power may tell investigators how likely it is that a statistically significant difference will be detected based on a finite sample size under a true alternative hypothesis.
All of the Power Analysis procedures now allow the user to enter a series of power values rather than a single one. These can take the form of separate (point) values, a series of values incremented by a specific amount, or a combination of both. This enhancement now results in a table of power values and, optionally, an accompanying power curve graph.
The procedure now supports the Price-Related Bias (PRB) dispersion method. PRB is an index of whether assessment to price ratios are systematically higher or lower for higher-priced properties. PRB regresses percentage differences in assessment ratios. The differences are drawn from the median ratio on the base 2 logarithms of value proxy measures. The proxy measures are calculated as the “averages of sales prices” and the “ratios of assessed values to the median ratio”. The method also gives the percentage change in assessment ratios for a 100 percent change in value.
The new COV dispersion method includes the median and mean-centered coefficients of variation and effectively replaces the Median Centered COV and Mean Centered COV dispersion methods. The median-centered coefficient of variation is the result of expressing the root mean squares of deviation from the median as a percentage of the median. The mean-centered coefficient of variation is the result of expressing the standard deviation as a percentage of the mean.
1. A new graphical user interface control was designed for GLM and UNIANOVA. Specifically, an additional Compare simple main effects checkbox was added to the EM Means… sub-dialog to support the specification of comparisons among the main effects nested within the levels of other factors.
2. Adjustments were made to Change Contrast in the LOGISTIC REGRESSION and COXREG dialogs:
a. The default reference category specification for contrast types that use reference category specifications (Indicator, Simple, and Deviation) was changed from Last to First.
b. The positions of the Last and First buttons were switched.
c. The listing of variables in the Categorical Covariates target list now includes (last).
3. In prior versions users were able to run a two-sided T-Test, but additional calculations were necessary to get output for a one-sided T-Test. Starting with V28 Beta, users will be able to run a one-sided T-Test through the dialogs.
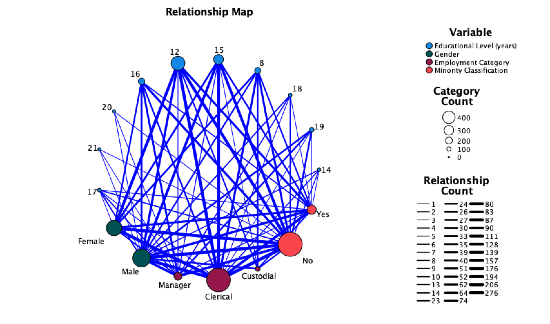
Users are now able to visually inspect the relationship across multiple variables as shown by the thickness of the connections and size of the categories indicator.
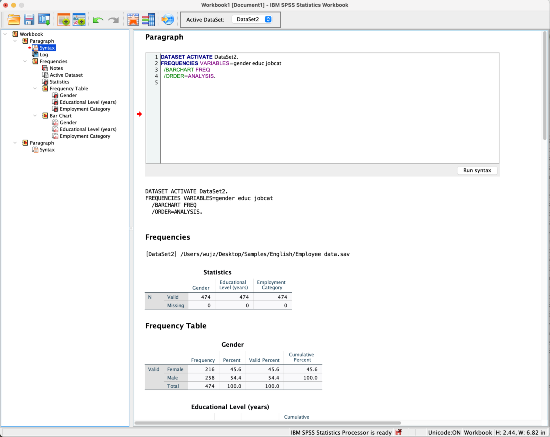
The Statistics Workbook combines multiple file types into one. Users are able to write Syntax, create output, and edit that output all in the Workbook for an interactive way to run data analysis.
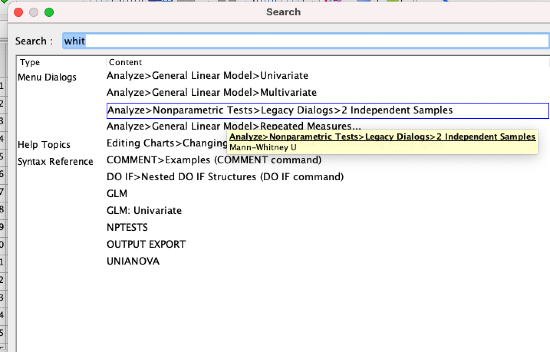
The search feature has been updated to now provide results for procedures, help topics, syntax reference, and case studies. It now searches all words/terms in each user interface dialog and help topic.
The table editing side pane reduces the number of clicks necessary to achieve a desired output.
Accessibility support for high contrast was added in SPSS Statistics 28.
If you’d like to purchase perpetual licences, buy licenses by subscription or upgrade to SPSS Statistics 28, check out our Product Page on our website.
Source: What’s New in SPSS Statistics 28 by Brent Gardiner